SAP Integration Suite Monitoring: Running Integrations in Production
Cloud Integration shows every message, but it raises no alerts by itself, so a failure at 2:00 waits for whoever opens the monitor. What the monitor and MPL API give you, how Alert Notification and Cloud ALM close the gap, what to watch in hybrid setups, and who acts.

Last technically reviewed: 18/11/2026. Reviewed by Marek Juračka, CTO.
Table of contents
An integration rarely fails loudly. A receiver certificate expires overnight, a JMS queue fills while a backend is down, or an order reaches the warehouse system and is rejected there. The first person to notice is often a planner asking why a shipment never left. SAP Integration Suite monitoring is about closing the gap between a technical event on the tenant and a person who knows what to do about it.
The platform gives operations teams a good local monitor, an OData API and several routes to central alerting. It does not give you someone watching the screen at 2:00. This guide covers what the Cloud Integration monitor shows, why it is not enough on its own, how SAP Alert Notification and SAP Cloud ALM fill the gap, what to watch in API Management, Event Mesh, Edge Integration Cell and Cloud Connector, and how to organise runbooks. It goes deeper than the monitoring section of our SAP Cloud Integration guide, with facts as documented by SAP in November 2026.
In short
The Cloud Integration monitor shows message processing logs, artefact status, security material, stores and queues, but someone has to open it: SAP states that Cloud Integration has no pre-built, out-of-the-box alerting.
Alerts come from SAP Alert Notification service, SAP Cloud ALM (Integration and Exception Monitoring), SAP Solution Manager or Focused Run, or your own tooling on the message processing log OData API.
Tooling covers the technical half; the other half is a named owner, a runbook and a reprocessing rule for every interface, agreed before go-live.
What does monitoring SAP Integration Suite involve?
Monitoring SAP Integration Suite means knowing, for every interface, whether messages flow, whether they fail, whether the connections and credentials they depend on are healthy, and whether the business outcome arrived. Each layer has its own data source and often its own owner:
Message processing: the status, error text and steps of each message in Cloud Integration.
Artefact health: whether integration flows and API artefacts are deployed and started.
Connectivity and credentials: Cloud Connector tunnels, receiver availability and certificate expiry, covered in our SAP Integration Suite security guide.
Platform resources: JMS queues, monitoring storage, Event Mesh spool and, on Edge Integration Cell, the Kubernetes workloads.
Business outcome: whether the receiving system posted the document, which the integration platform often cannot see.
The components behind these layers are introduced in our SAP Integration Suite architecture article.
What does the Cloud Integration monitor show?
The Monitor section shows the message processing log (MPL) for each message, the status of deployed content, security material and keystore, data stores, variables, message queues, system logs and locks. It is the first place to look in any Cloud Integration incident.
According to SAP's Monitor Integrations documentation, the start page has areas for message processing, integration content, security, stores, access logs and locks, with tiles each user can filter, for example to failed messages of one package.
The message monitor
The message monitor filters messages by time, status, artefact type, package, artefact and ID. SAP's Monitor Message Processing page lists the attributes per message, including status, processing time, log level, sender, receiver, application message ID and type, correlation ID, custom status and archiving status. The detail pane adds the last error, custom header properties, the log, retry runs and attachments.
Several fields stay empty unless the flow fills them, usually with a Content Modifier or, for custom header properties, a script. A flow that stores the order or delivery number there lets a support analyst find a message by business key in one search.
Message statuses worth understanding
SAP's Message Status page defines eight statuses for single messages. Besides COMPLETED, PROCESSING, CANCELLED and DISCARDED, four drive most operations questions:
Status | What SAP says it means | Operational reading |
FAILED | Not delivered and no retries possible; a final status | Needs a person: fix the cause, then reprocess |
RETRY | An error occurred and a retry started automatically | Watch the trend; a message stuck here may need intervention |
ESCALATED | An error occurred and no retry was triggered; synchronous senders get an error | Check whether the flow should handle this error itself |
ABANDONED | Processing interrupted or the log not updated for unusually long; not final | Check after redeployments and node restarts; processing can resume if retries are configured |
Log levels and retention in brief
The log level, set per integration flow, decides what the MPL records; our Cloud Integration guide covers the five levels. Three points matter for operations, all from SAP's Setting Log Levels page:
None records nothing, so the flow is invisible to the monitor and to any tool that reads MPLs.
Error records failed messages only, and a final successful retry is not recorded, so the status can stay at Retry or Failed although the message was delivered.
Debug expires after a fixed 24 hours and Trace after 10 minutes by default; Trace content is kept for 1 hour by default.
Monitoring data, including the MPL, is stored for 30 days by default, according to SAP's Archiving Data page. For longer retention, MPLs can be archived to a CMIS 1.1 content management system, depending on the service plan, and monitoring that system is your responsibility. External logging to Splunk or OpenTelemetry is the other route. The monitoring storage usage view compares consumption with the assigned capacity (35 GB by default); exceeding it does not stop logging, but SAP then cannot ensure optimal monitoring performance.
The OData API for message processing logs
Everything in the message monitor is also available programmatically. SAP's Message Processing Logs API documentation lists resources for logs, adapter attributes, attachments, custom header properties and error information. A client needs the MonitoringDataRead role template, plus MessagePayloadsRead for attachments, and Edge Integration Cell has its own variant. Custom dashboards and SAP's own alerting package build on this API.
Question | Where to look |
What happened to order 4711? | Message monitor, by application message ID or custom header property |
Why did this message fail? | Message details: last error, then the MPL steps |
Is the flow deployed and started? | Manage Integration Content |
Is a certificate about to expire? | Keystore (Valid Until column) or Cloud ALM health monitoring |
Are messages piling up between flows? | Manage Stores, Message Queues |
How many messages failed per flow this week? | MPL OData API or Cloud ALM |
Why is built-in monitoring not enough?
The monitor answers questions but does not ask them. SAP's migration guide states that Cloud Integration is not delivered with pre-built out-of-the-box alert capabilities, and points to SAP Alert Notification, SAP Cloud ALM and SAP Solution Manager instead (Migration Guide: Monitoring).
For teams coming from SAP PI/PO, which offered component-based message alerting, this is a real operational change, as our PI/PO to Cloud Integration migration guide notes. Without an alerting layer, the gaps are predictable:
Nobody is looking. A FAILED message at 2:00 waits until the morning, or the end of the weekend.
Silence is invisible. If a sender stops sending, nothing looks wrong. Missing messages need a volume expectation.
Each tenant is separate. Development, test, production and Edge Integration Cell runtimes each have their own view.
History is short. Trend questions beyond 30 days need archiving, external logging or a central tool.
Logging choices hide errors. Flows at None, or at Error with retries, report less than operations may assume.
What are the alerting options?
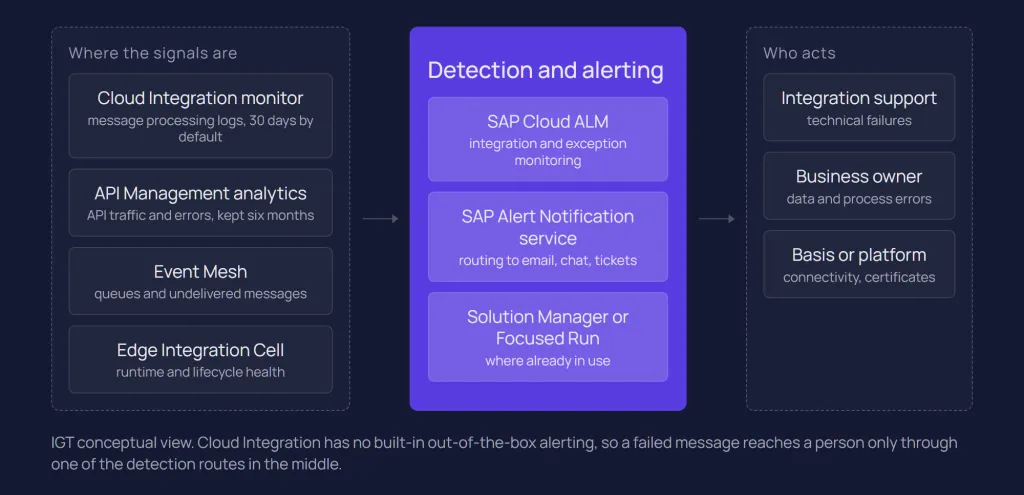
There are four routes: SAP Alert Notification service, SAP Cloud ALM, SAP Solution Manager or Focused Run, and custom tooling. Many estates combine two, for example Cloud ALM for central monitoring and Alert Notification for routing into chat or ticketing tools.
SAP Alert Notification service
SAP Alert Notification service is a BTP service with a common API for publishing and subscribing to events. According to SAP's Alert Notification documentation, subscribers choose a channel such as email, a custom webhook or an external system, with native support for Slack, Microsoft Teams, ServiceNow and others, and failed deliveries are retried.
Cloud Integration does not push failures to it by itself. SAP's migration guide names a predelivered integration package: its configuration guide on SAP Business Accelerator Hub describes a timer-started flow that reads failed messages through the MPL API, groups them by integration flow and sends notifications with the event type CPIIntegrationFlowExecutionFailure, looking back at most three days. SAP's current Alert Notification documentation still describes this event and links the same package (Integration Flow Execution Failure). Alternatively, your own flows can call the Alert Notification APIs, for example from an exception subprocess, with full control over the content.
SAP Cloud ALM: Integration and Exception Monitoring
SAP Cloud ALM's Integration and Exception Monitoring is the central monitor SAP points to for Integration Suite. SAP's Central Monitoring and Alerting Solutions page describes end-to-end monitoring of cloud and hybrid scenarios, correlation of messages across components, search by business context, an embedded alert inbox, and notifications by email, chat or tickets, with links back to the local monitor.
For Cloud Integration, SAP's Cloud ALM setup page describes two categories:
Messages: status and performance of single messages, with events for single or grouped failures, high processing time, and volume that is too low or too high.
Integration Content: one event per non-operational artefact, for example after a failed deployment, closed automatically when the artefact recovers.
SAP notes that Cloud ALM only captures existing MPLs, so flows at log level None do not appear. Its volume events are what make silence detectable. Health monitoring adds certificate validity across tenants and JMS resources, and Edge Integration Cell and Trading Partner Management can also report to Cloud ALM.
SAP Solution Manager, Focused Run and custom tooling
SAP positions Solution Manager for on-premise products. For Cloud Integration, SAP's Solution Manager setup page describes Interface and Connection Monitoring with Exception Management, which collect integration flows in error status, single exceptions and response times and raise alerts on them. SAP recommends Focused Run for service providers and large on-premise landscapes. Where Splunk or another observability platform already exists, the OData API and external logging feed it, keeping one view across SAP and non-SAP platforms such as webMethods, at the cost of maintaining queries and rules yourself.
Option | Covers | Watch out for |
SAP Alert Notification service | Routing events to email, chat, webhooks and ticketing | Cloud Integration failures need the SAP package or your own flows to create events |
SAP Cloud ALM | Central monitoring, correlation, business search, alert inbox, health checks | Only existing MPLs are captured; scenarios and alert rules need design |
Solution Manager or Focused Run | Central monitoring for on-premise-heavy estates and service providers | Needs Interface and Connection Monitoring and Exception Management set up; SAP positions Solution Manager for on-premise products |
Custom tooling | Whatever you build on the OData API or external logs | Queries, rules and credentials are yours to maintain |
Whichever route you choose, the alert path has the same stages, and each needs an owner:
A message fails, or an expected message does not arrive.
The MPL records it, if the log level allows.
A detector picks it up: Cloud ALM, the Alert Notification package or your own query.
The event is routed by interface and severity to a channel, on-call rota or ticket queue.
A named person follows the runbook, fixes the cause and decides how to reprocess.
How do you monitor APIs and events?
APIs and events have their own monitors: API Management analytics for proxies, and the Event Mesh monitor for the broker. Cloud Integration's JMS queues deserve a check of their own.
SAP's Advanced API Analytics page describes Overview, Health and Usage reports, and the dashboard retains data for six months, according to SAP's dashboard guide. Separating total API errors from target system errors helps decide who gets called. Anomaly detection, an AI feature SAP offers only in the Premium and Enhanced Editions (as a free promotion until the January 2027 release), can send alerts through SAP Alert Notification service (Subscribing to Notification Alerts). More on proxies and policies is in our SAP API Management guide.
The Event Mesh monitor shows message rates, spool and connection usage, and per queue the messages queued and unacknowledged, and per message the delivery count and dead message queue eligibility (Monitor Event Mesh). A backlog shows in the broker while the consuming flow's failures show in Cloud Integration, so runbooks need both views; our SAP Event Mesh guide covers the limits.
Inside Cloud Integration, JMS queues decouple flows and carry retries. SAP's JMS resource limits page notes that capacity is limited and unused queues are not deleted automatically. A growing queue is often the first sign of a receiver outage, so IGT recommends making queue depth part of the daily check.
What should you monitor in hybrid setups?
In hybrid landscapes, part of the integration runs or connects inside your own network. Edge Integration Cell and SAP Cloud Connector each add a layer that SAP does not operate for you.
Edge Integration Cell
Messages processed on Edge Integration Cell appear in the same monitor once you select the runtime, with a narrower feature set: SAP's Edge Integration Cell monitoring page lists message status, the MPL, adapter tracing, the text view and log levels.
The runtime is monitored through Edge Lifecycle Management, with Grafana dashboards for system metrics and components such as stuck artefacts, heap memory and busy threads on the worker (System Monitoring). Predefined alert rules cover the message service, such as connection and storage usage above 80% and 95%, and the worker, such as an artefact stuck in transition for more than 60 minutes; they are delivered through SAP Alert Notification service (Alerting). An external Prometheus can scrape the metrics instead, and MPLs can be pushed to Cloud ALM or Focused Run (Monitor Message Processing on SAP Focused Run and SAP Cloud ALM).
The Kubernetes cluster, database and data store underneath are part of your landscape. IGT recommends agreeing early whether the integration team or the platform team receives the infrastructure alerts.
SAP Cloud Connector
SAP's Cloud Connector alerting documentation describes email alerts for high availability, tunnels and service channels, CPU load (default above 90% for over 60 seconds), free disk space (default below 100 MB) and certificate expiry (default 30 days ahead). Certificate alerts cover only certificates whose private key Cloud Connector holds, not trust store entries. Monitoring APIs expose health, connections, certificate status and alerts to external tools. Setup is covered in our SAP Cloud Connector guide.
Business monitoring vs technical monitoring
Technical monitoring tells you a message was delivered; business monitoring tells you the transaction succeeded. A COMPLETED status in Cloud Integration means the receiver accepted the call, not that it posted the document.
An IDoc can reach S/4HANA and fail in application processing because a material is not maintained for the plant. A MES can accept a production order message and then reject the order in its own log. Neither is a failed message on the integration tenant. They need monitoring in the receiving system, or a reply message that the flow evaluates. For S/4HANA, SAP's migration guide names SAP Application Interface Framework for resolving interface errors after deployment. Across systems, Cloud ALM's business context search helps if flows write business keys into the log, and Trading Partner Management can publish B2B interchange data with a document ID to Cloud ALM (Publish B2B Data to SAP Cloud ALM).
IGT recommends deciding at design time, per interface, what counts as success and where it is visible. The answer often shapes the pattern itself, for example a confirmation message instead of fire-and-forget, as discussed in our SAP integration patterns article.
Runbooks and ownership
An alert is only useful if a specific person receives it and knows the next step. In many SAP estates the tooling arrives long before the ownership, and alerts land in a shared mailbox nobody reads.
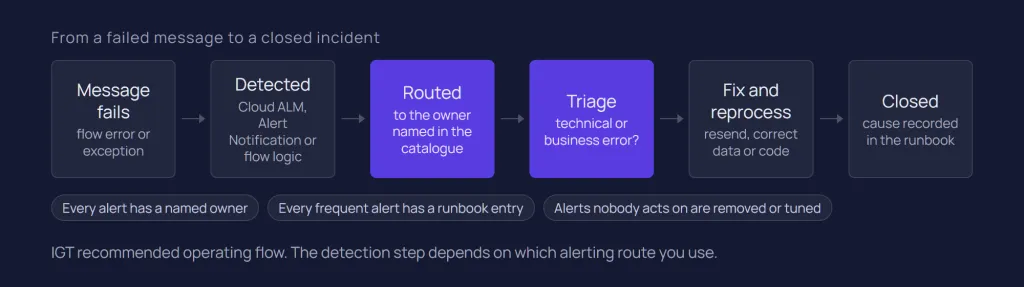
IGT recommends that each production interface has:
A technical and a business owner. The integration team fixes flows and connections; a named business contact decides on data errors and reprocessing.
A severity and a route. Which failures page someone out of hours, which open a ticket, and which wait for the morning.
A runbook entry. Typical errors and causes, where to look, contacts on the other side and the escalation path.
A reprocessing rule. Whether a message can simply be resent, whether the receiver tolerates duplicates, and who triggers it; our SAP Integration Suite error handling article covers the flow design.
A volume expectation. Roughly how many messages are normal per hour or day, so silence can raise an alert.
A checklist to review before go-live and then quarterly:
Production flows run at Info or higher, unless a documented reason says otherwise.
Flows log a business key as application message ID or custom header property.
Failed messages and non-operational artefacts raise alerts.
Alerts reach a named team, with the runbook linked from the alert text.
Certificates on the tenant and in Cloud Connector have owners and expiry monitoring.
JMS and Event Mesh queue depth is checked daily.
Retention beyond 30 days is covered by archiving or external logging.
Edge Integration Cell infrastructure alerts have an agreed receiver.
These rules belong in your wider standards for building and approving interfaces, covered in our SAP integration governance article.
Conclusion
SAP Integration Suite provides solid raw material for operations: a detailed message monitor, clear statuses, an OData API and documented connections to SAP Alert Notification, SAP Cloud ALM and Edge Lifecycle Management. What it does not provide out of the box is alerting, and no tool provides ownership.
A workable setup combines a central detector, routing into tools teams already use, flows that log business keys, and a runbook per interface. The principles are platform-neutral, so in a mixed SAP and webMethods estate it pays to define them once for both.
If you are setting up operations for SAP Integration Suite, or alerts in your estate arrive too late, our SAP integration services cover design, delivery and operations reviews. Talk to our SAP integration team.
Related questions
How do you monitor SAP CPI?
Use the Monitor section of SAP Integration Suite for message processing logs, artefact status, keystore, stores and queues, with log levels set per integration flow. For production, add alerting through SAP Cloud ALM, SAP Alert Notification service or your own tooling on the Message Processing Logs OData API.
Does SAP Integration Suite have alerting?
Not for Cloud Integration out of the box: SAP's migration guide states that it has no pre-built alert capabilities. Alerts come from SAP Alert Notification service, SAP Cloud ALM, SAP Solution Manager or custom tooling. Edge Integration Cell and Cloud Connector do include predefined alert rules for their own components.
What is SAP Cloud ALM integration monitoring?
Integration and Exception Monitoring in SAP Cloud ALM is SAP's central monitor for integrations across cloud and hybrid landscapes. For Cloud Integration it collects message processing logs and non-operational artefacts, correlates messages across components, and raises events for failures, slow processing and unusual volumes.
How long are message logs kept in SAP Cloud Integration?
Monitoring data, including message processing logs, is stored for 30 days by default, and trace content for 1 hour by default. For longer retention, archive logs to a CMIS-compatible content management system (depending on the service plan) or send them to an external logging system.
Sources
SAP Help Portal: Integration Flow Execution Failure (SAP Alert Notification service)
SAP Help (SAP-docs): Monitor Integrations
SAP Help (SAP-docs): Monitor Message Processing
SAP Help (SAP-docs): Message Status
SAP Help (SAP-docs): Setting Log Levels
SAP Help (SAP-docs): Archiving Data
SAP Help (SAP-docs): Inspect Monitoring Storage Usage
SAP Help (SAP-docs): Message Processing Logs (OData API)
SAP Help (SAP-docs): Use Custom Header Properties to Search for Message Processing Logs
SAP Migration Guide for SAP Process Orchestration (SAP-docs): Monitoring
SAP Help Portal: What Is SAP Alert Notification Service?
SAP Help (SAP-docs): Central Monitoring and Alerting Solutions
SAP Support: SAP Cloud ALM Integration and Exception Monitoring
SAP Support: SAP Cloud ALM for SAP Integration Suite (Cloud Integration)
SAP Support: SAP Solution Manager monitoring for SAP Integration Suite, Cloud Integration
SAP Help (SAP-docs): Advanced API Analytics
SAP Help (SAP-docs): Find Your Way around Advanced API Analytics Dashboard
SAP Help (SAP-docs): Subscribing to Notification Alerts
SAP Help (SAP-docs): Monitor Event Mesh
SAP Help (SAP-docs): JMS Resource Limits and Optimizing their Usage
SAP Help (SAP-docs): Monitor Message Processing for Edge Integration Cell
SAP Help (SAP-docs): Edge Integration Cell System Monitoring
SAP Help (SAP-docs): Edge Integration Cell Alerting
SAP Help (SAP-docs): Monitor Message Processing on SAP Focused Run and SAP Cloud ALM
SAP Help (SAP-docs): Set Up External Prometheus Monitoring for Edge Integration Cell
SAP Help (SAP-docs): Cloud Connector Alerting
SAP Help (SAP-docs): Cloud Connector Monitoring APIs
SAP Help (SAP-docs): Publish B2B Data to SAP Cloud ALM
SAP Migration Guide for SAP Process Orchestration (SAP-docs): Interface Migration Strategy
Latest writings
The latest news, technologies, and resources from our team.
View all blogs


Let’s make it click!
Whether you're scaling a startup or streamlining a corporate ecosystem, we help teams launch faster and integrate smarter.

Eva Polcíková
Project Manager